
Stay Informed
Creating a community free of domestic violence requires continual information sharing and dialogue. Stay connected with us through the information resources on this page and – please – share what you learn.
Stay Informed
Join Our Email Newsletter
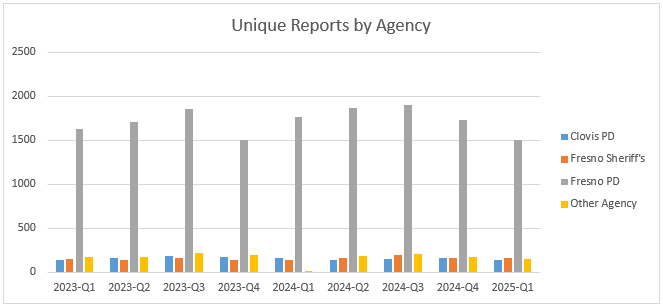
What Does Data Show about DV in our Community?

Since January 2023, there have been 19,360 unique reports.
- Fresno PD – 14,980 reports (77%)
- Clovis PD – 1,425 reports (7%)
- Fresno County Sheriff’s Office – 1,438 reports (7%)
- Other Departments – 1,517 reports (8%)
- Some seasonality is beginning to present in the number of unique reports. Total numbers increase through summer and then decrease in the last quarter.
Majority of reports (12,392, or 64%) came from a residence (either single family or multi-family dwelling)
- Only 10% (1,966 reports) came from “street/highway”
- 5% (987 reports) came from a business location
- 3,422 reports (18%) were categorized as “other” by officers
- 21 reports came from “online” interactions, 19 from Clovis PD and 2 from Fresno PD
For the first quarter of 2025, average weekly reports, county-wide, was 156.
- First quarter of 2024 saw an average 163 reports per week while first quarter 2023 saw an average of 167 weekly reports.
- The 2025 weekly average represents a 5% decrease over 2024 and an 8% decrease over 2023.
- Weekends continue to show an increased number of reports, with Saturday and Sunday accounting for 32% of all reports.
For first quarter 2025, there were 5,199 offenses committed with 5,051 suspects.
- Fresno PD – 4,214 offenses (81%)
- Fresno County Sheriff’s Office – 385 offenses (7%)
- Clovis PD – 172 offenses (3%)
- Other departments – 428 offenses (8%)
Most common types of offense relate to physical violence (48%)
- Violations of restraining orders are still the second most common offense type, at 12%, and instances of child abuse come in third at 10%.
- Violations of restraining order have remained constant compared to Q1 2023 and Q1 2024.
- However, violations relating to physical violence and child abuse have both increased 50% over Q1 2024.
- Compared to Q1 2023, violations related to child abuse nearly doubled in 2025.
Q1 2025 also saw the highest number of offenses with Alcohol listed as a factor (782). This shows a 50% increase over Q1 2024 and a 104% increase over Q1 2023.
Q1 2025 saw that the majority of victims (50%-65%) are between the ages 25-44, for nearly all race/ethnic groups.
- The only exception was for Native Americans/Alaska Native. For this group, victims age 25-44 were only 32% of the total, with another 28% age 18-24.
- For suspects, the majority were age 25-44 regardless of race/ethnicity.
- These demographics hold true for the entire period Jan 2023 – March 2025.
Subscribe
Press Releases
MMC in the Media
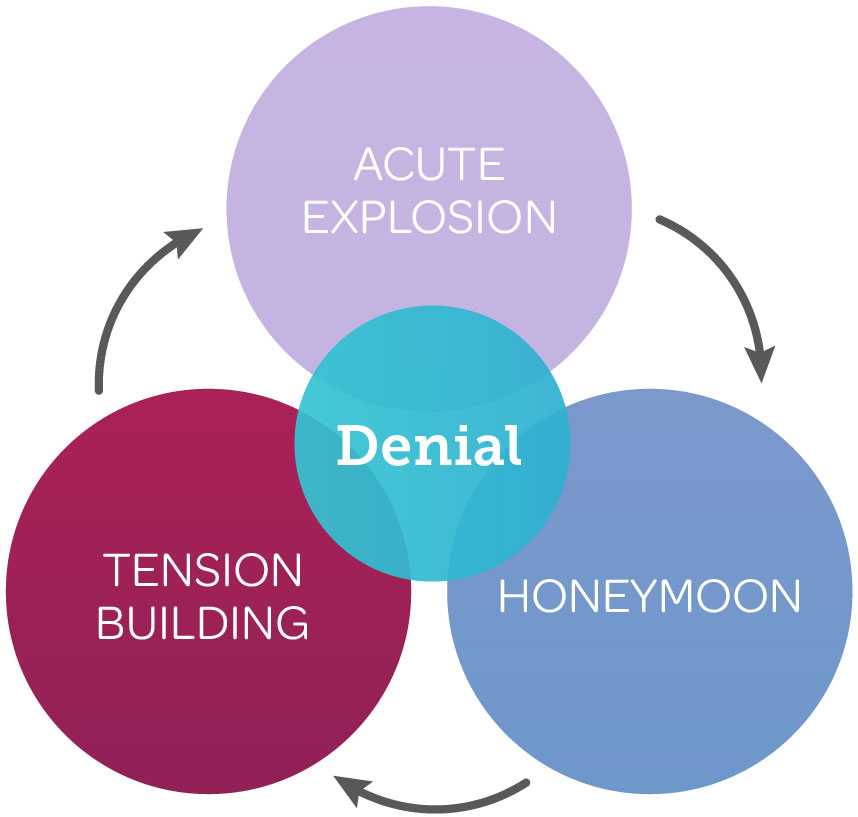
Understanding the Cycle of Domestic Violence
What Everyone Needs to Know About Domestic Violence
Why does discussing domestic violence matter? 1 in 4 women will be affected by domestic violence in her lifetime. Over 7,000 domestic violence cases were reported locally last year. Typically DV is reported after the 8th incident.